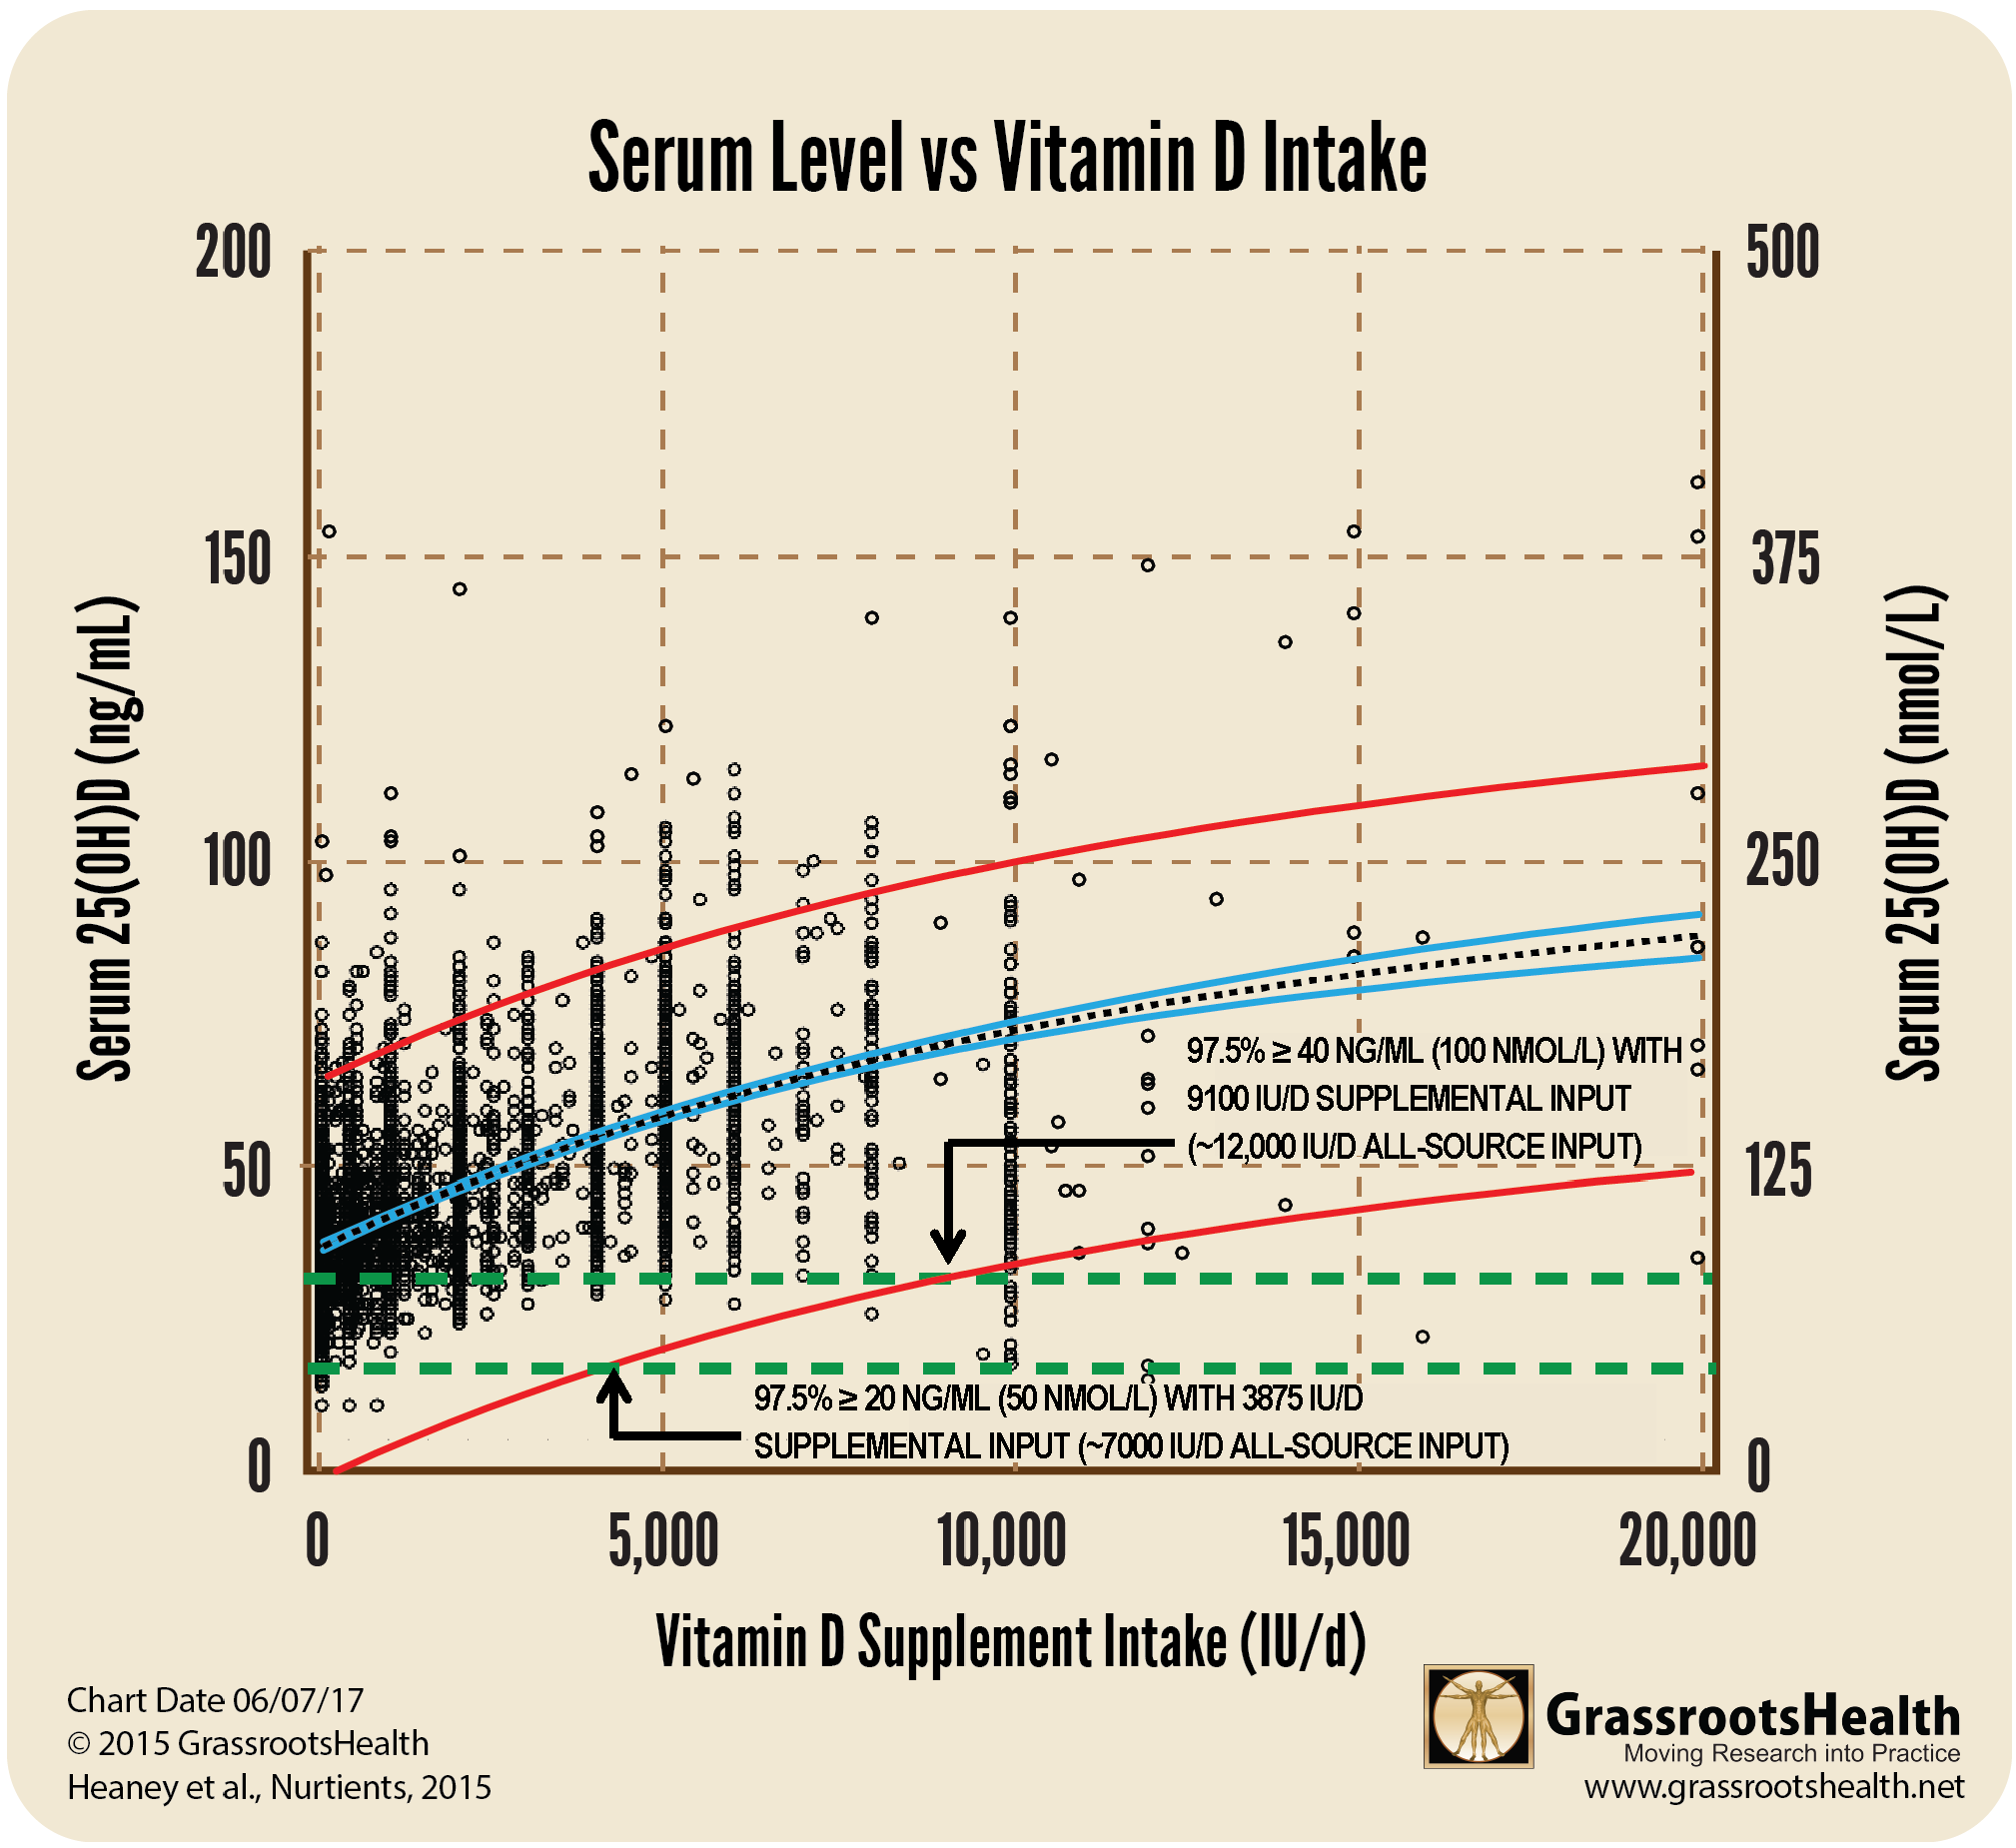
This figure shows a plot of the 25(OH)D values as a function of reported vitamin D intake amounts. The black dotted line is the best fit line through the data, the blue lines are the 95% confidence limits, and the outer red lines are the 95% probability bands.
The point at which the horizontal green line at 40 ng/ml intersects with the lower probability band (red line) reflects the supplemental input necessary to ensure that 97.5% of the cohort would have a 25(OH)D concentration ≥40 ng/ml (~9100 IU/day).
The point at which the horizontal green line at 20 ng/ml intersects with the lower probability band (red line) reflects the supplemental input necessary to ensure that 97.5% of the cohort would have a 25(OH)D concentration ≥20 ng/ml (~3875 IU/day).
The best fit line intersects the Y-axis at a value of 34 ng/ml, reflecting an intake from food and sun amounting to ~3000 IU/day. Therefore, the total intake required to achieve 40 ng/ml in 97.5% is ~12000 IU/day.
This figure demonstrates:
(i) the gradual rise of serum 25(OH)D with increasing dosage;
(ii) there is a very large spread of 25(OH)D values at each dose; and
(iii) very few individuals had serum 25(OH)D values above 150 ng/ml.
Chart Date: 6/7/17
©2016 GrassrootsHealth. Heaney et al., Nutrients, 2015.